Energy efficiency is arguably the most promising strategic area to reduce greenhouse gas emissions. By decreasing energy demand, energy efficiency initiatives help reduce:
- The pressure on our energy system
- The amount of installed clean energy capacity required to substitute current fossil fuel production
- Our dependence on foreign fossil fuels, thereby increasing energy independence and stability
While countries have the ability to drastically decrease emissions through energy efficiency measures, their levels of investment and implementation of these options have been mixed.
McKinsey & Company – a multinational management consulting firm – has done several studies on the emissions reduction capacities of different nations – evaluating different measures available to each country and the cost-effectiveness (cost per ton of CO2e reduced) of their implementation. In these studies, McKinsey often uses a Marginal Abatement Cost Curve (MACC) to help illustrate each option’s cost-effectiveness (on the Y-axis) and emissions reduction potential (on the X-axis):
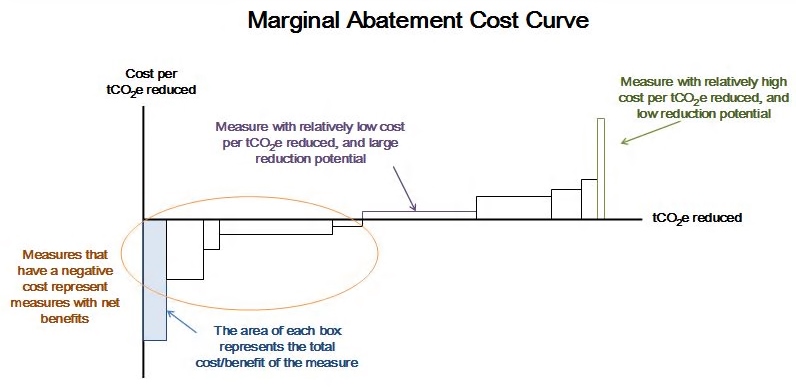
McKinsey takes a good look at the emissions reduction potential available through energy efficiency initiatives. Their results show that energy efficiency options tend to have a net economic benefit to society – the total benefits to society are greater than the total costs over the lifetime of the project. Three examples – case studies for the US, China, and India – are looked at in detail:
The United States:
Based on a McKinsey report published in December 2007, the United States could have reduced Greenhouse Gas (GHG) emissions by 3 – 4.5 Gigatons of CO2e in 2030 through a large range of abatement options that cost less that $50 per ton. This average cost could be even lower “if the nation [could] capture sizeable gains from energy efficiency”.
According to the research, almost 40% of abatement could be achieved at “negative marginal costs” – the investment in these abatement measures would bring a net economic benefit to society over the life of the investment (see the example MACC graph above). Nearly all of these abatement options were in energy efficiency. McKinsey calculates that “the cumulative savings created by these negative cost options could substantially offset (on a societal basis) the additional spending required for the options with positive marginal costs”.
Approximately 1.4 gigatons of CO2e could be abated with these negative-cost options, which is more than the GHG emissions of Japan (1.3 gigatons) or Germany (1 gigaton) in 2005. This fact shows the significant impact that energy efficiency measures could have on reducing GHG emissions in the United States.
This may sound like a “no-brainer” for the US economy; however, there are several barriers keeping the US from reaping these easy wins. According to the McKinsey analysis, “costs will tend to concentrate in some sectors than others, and involve ‘real’ up-front outlays that would be offset by ‘avoided’ future delays”. They state that, “given the timing of investments relative to savings, the economy might well encounter periods of significant visible costs, with costs and benefits shared unequally among stakeholders”. (More information on barriers to energy efficiency is detailed in a previous post)
Time Perishable Opportunities
Unfortunately, many of the abatement options available to the US are “time perishable” – if energy efficiency measures are not implemented early, these options will no longer be available in the future. In some cases, costs associated with other options would therefore increase. The cost of building energy efficient buildings, factories, and technology is a fraction of the cost of retrofitting this infrastructure later or retiring it early in order to replace the infrastructure with more efficient models.
Additionally, without the implementation of energy efficiency measures, the demand for energy will increase quicker than with efficiency investments, increasing the pressure on energy production. Consequently, the amount of investment in cleaner technologies, like renewable energy and Carbon Capture and Storage, would need to increase to meet this higher demand. McKinsey calculates that “improving energy efficiency in the buildings-and-appliances and industrial sectors, for example, could… offset some 85 percent of the projected incremental demand for electricity in 2030… Similarly, improved vehicle efficiency could roughly offset the added mobility-related emissions of a growing population, while providing net economic gains”.
So, how has the US done?
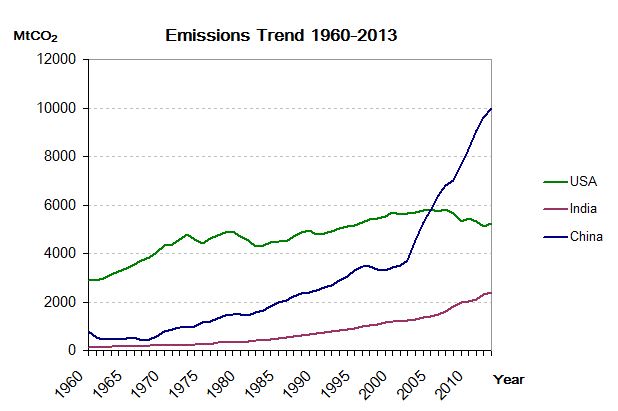
CO2 emissions in the US fell by 430 Mt (7.7%) between 2006 and 2011 – the largest reduction during that period of all countries or regions in the world (yes, you read that right). According to the International Energy Agency (IEA), “this development has arisen from lower oil use in the transport sector (linked to efficiency improvements, higher oil prices and the economic downturn which has cut vehicle miles travelled) and a substantial shift from coal to gas in the power sector”. This trend, however, has run its course; emissions in 2013 bounced back, increasing 2.9%.
China:
Similar to the US, China’s ability to capture many of the benefits of energy efficiency options relies on swift action due to the “time perishable” aspect of many of the measures. In 2009, McKinsey calculated that over the next 5 to 10 years, China would continue their rapid growth in the building and industry sectors. They estimated that “just a 5 year delay in starting to implement the abatement technologies we describe in our study would result in a loss of as much as one-third of the total abatement potential by 2030. If China waited 10 years before beginning to implement these technologies, it would lose up to 60 percent of the total abatement potential by 2030”.
So, how has China done?
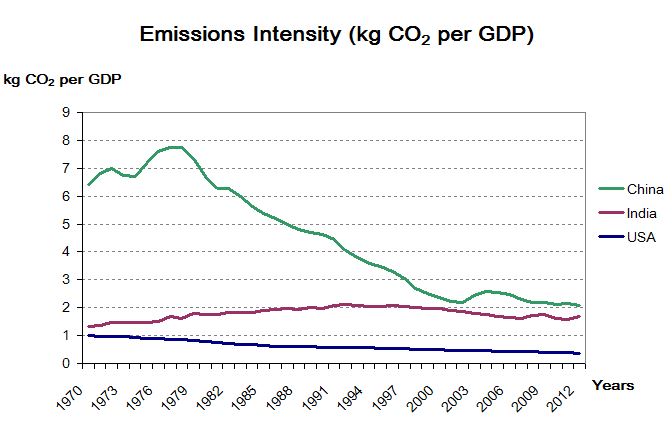
In 2013, China’s emissions grew 4.2%; it is the largest contributor of global emissions (28% of total global emissions in 2013). However, China’s carbon intensity (the amount of CO2 emitted per unit of GDP) declined 15% between 2005 and 2011, while GDP increased 224% (World Bank Statistics). In 2012, IEA Chief Economist Fatih Birol stated, “what China has done over such a short period of time to improve energy efficiency and deploy clean energy is already paying major dividends to the global environment”.
Nevertheless, given the expected growth of the Chinese economy, China still has a significant challenge ahead of them to promote efficient, clean growth.
India:
According to the McKinsey report published in 2009, India presented a unique case in terms of energy efficiency options. In 2009, “80 percent of the India of 2030 [was] yet to be built”. India, therefore, was a perfect example of the impact of “time perishable” possibilities and presented a unique opportunity to promote low carbon growth. McKinsey’s analysis of the Indian economy states that achieving low carbon growth would require India to “leapfrog inefficient technologies, assets and practices and deploy ones that are more efficient and less emissions-intensive”.
McKinsey calculated that over 60% of the abatement opportunities would impose a net economic cost to society and would require an average funding of 18 billion euros per year between 2010 and 2030. Capital barriers and technological capacity were expected to be the two largest barriers for implementation. However, without this investment, India’s energy demand was expected to double by 2030, making it the third largest energy consumer in the world after the US and China.
Most of the available efficiency savings were found in the industry and building sectors. As an example, given that India is one of the hottest countries in the world, McKinsey estimated that, with their expected economic growth, 60% of commercial buildings and 40% of homes in India will have air conditioning by 2030. The increased demand for electricity – due in large part to a greater access to appliances – is estimated to increase electricity consumption from 140 TWh in 2005 to 1,300 TWh in 2030. This amounts to an additional 1.2 billion tones of CO2e. Implementing energy efficiency in the development of India’s future industry and infrastructure could decrease expected electricity demand by one quarter.
Similar to China and the US, many of these energy efficiency options are “time perishable”. McKinsey estimated that a 5 year delay in implementation would cost India up to one quarter of its emissions abatement options.
So, how has India done?
According to data from the Global Carbon Atlas, in 2008, India’s emissions surpassed those of Russia, making it the third largest emitter behind China and the United States. India’s emissions intensity has stayed relatively stable, improving less than 4% from 2008 to 2012 (Global Carbon Atlas). From 2008 to 2013, India’s emissions grew 32.9% (Global Carbon Atlas), while GDP increased 53% (World Bank Statistics). The data does not reflect a significant change in energy efficiency or technology “leapfrogging” (moving directly to efficient, clean energy) recommended by McKinsey five years ago.
Image Credit: Amy Blyth
I actually love how it is simple on my eyes and in addition the data are nicely written. I’m wondering how I might be notified every time a brand new put up has been made. I’ve subscribed to your rss feed which must do the trick!
Nice post. Cheers for writing. Totally agree with what you said. Energy monitoring is the current trend now. Businesses should be more exposed to all these solutions and how it can help them reduce overhead and increase profits.